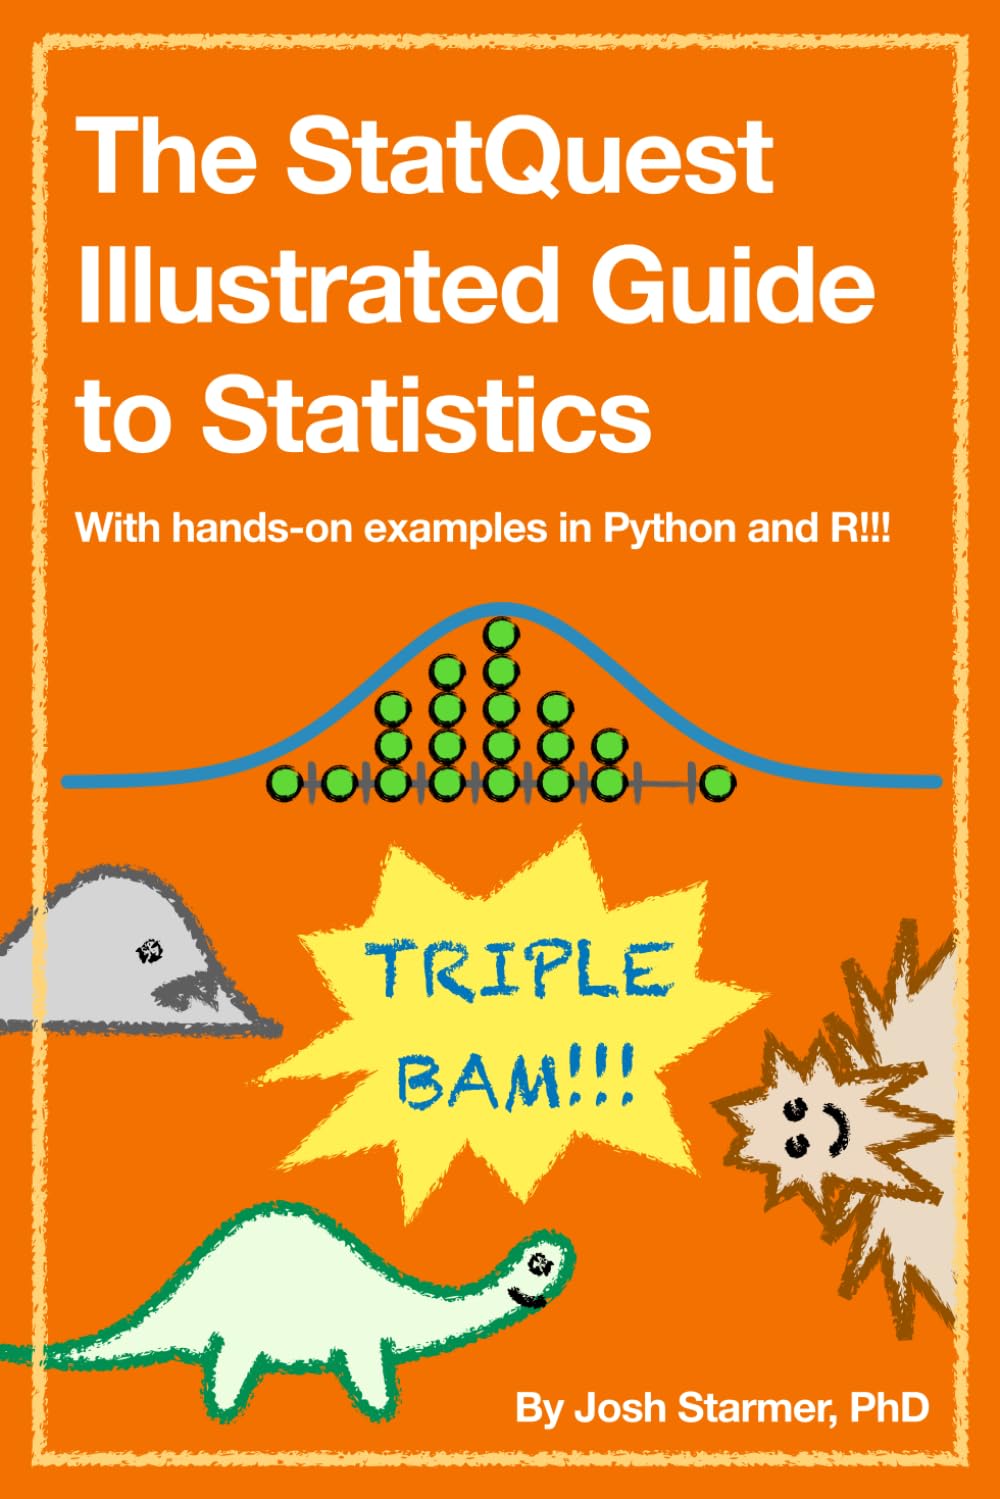
If you’re diving into the world of statistics and feeling a bit lost among all the formulas and theories, let me tell you about Josh Starmer’s StatQuest Illustrated Guide to Statistics. It’s like having a friendly guide who breaks everything down with simple illustrations and real-world examples in Python and R. I mean, who wouldn’t want that?
Think about it: statistics isn’t just about memorizing equations; it’s about understanding how to apply them to solve actual problems. The book is perfect for folks like you—maybe you’re a student grappling with data science coursework, a programmer wanting to add stats to your toolkit, or even a professional in business or research needing to make sense of numbers. The hands-on examples mean you’re not just reading; you’re coding along, which is the best way to really learn.
Here’s why I dig this approach:
- It starts with basics and builds up, so if you’re new, you won’t feel overwhelmed—it’s all about that gradual ‘aha’ moment.
- The illustrations make complex ideas click faster than a traditional textbook ever could; imagine graphs and visuals that turn abstract concepts into something tangible.
- With Python and R integrated throughout, you are getting practical skills that translate directly to real jobs in data analysis or machine learning.
So, if you’re serious about getting good at statistics without the usual frustration, grab this book and start experimenting. It is not just another read—it’s a tool that’ll make you smarter in no time.