When you are working with matplotlib, one of the first things you’ll want to get a handle on is customizing the axes. The default settings can be quite limited, and tweaking them can make your plots not only more informative but also visually appealing.
The axes in matplotlib are handled through the Axes class, which allows you to customize the appearance and behavior of your plots. You can adjust properties such as limits, ticks, labels, and more. For instance, to set the limits of the x and y axes, you can use the xlim and ylim functions.
import matplotlib.pyplot as plt

# Sample data
x = [1, 2, 3, 4, 5]
y = [2, 3, 5, 7, 11]

plt.plot(x, y)

# Set limits for x and y axes
plt.xlim(0, 6)
plt.ylim(0, 12)

plt.show()
Adjusting the ticks is another crucial aspect. By default, matplotlib determines the ticks automatically, but you can specify your own. The xticks and yticks functions allow you to set the positions and optionally the labels for these ticks. This can be particularly useful for ensuring that your plot is easy to read.
plt.plot(x, y)

# Customize ticks
plt.xticks([1, 2, 3, 4, 5], ['One', 'Two', 'Three', 'Four', 'Five'])
plt.yticks([2, 4, 6, 8, 10, 12], ['Two', 'Four', 'Six', 'Eight', 'Ten', 'Twelve'])

plt.show()
Font size and rotation of tick labels can also be adjusted. That is vital in ensuring that your plot is not just accurate but also legible. You can use the fontsize parameter and the rotation parameter to manipulate the appearance of the tick labels.
plt.plot(x, y)

# Customize ticks with font size and rotation
plt.xticks(rotation=45, fontsize=12)
plt.yticks(fontsize=10)

plt.show()
Another important aspect of axis customization is labeling. The xlabel and ylabel functions allow you to set the labels for the axes, enhancing clarity. You can also adjust their font size and style.
plt.plot(x, y)

# Label axes
plt.xlabel('Custom X Label', fontsize=14, fontweight='bold')
plt.ylabel('Custom Y Label', fontsize=14, fontweight='bold')

plt.show()
Moreover, you might want to add a title to your plot to summarize its content effectively. The title function provides a simpler way to accomplish this. You can add style parameters here too, making your title stand out.
plt.plot(x, y)

# Title
plt.title('My Custom Plot Title', fontsize=16, fontweight='bold')

plt.show()
Understanding these basics of axis customization will significantly enhance the quality of your visualizations. While it may seem trivial at first, the impact of a well-customized plot can be profound. It can mean the difference between a confusing chart and one that conveys information clearly and effectively. The key is to experiment with these settings until you find a balance that works for your particular dataset and audience.
As you dive deeper into customizing your plots, keep in mind that some common pitfalls can trip you up. For instance, ensuring that your tick marks do not overlap with labels very important. Use the tight_layout function to automatically adjust subplot parameters to give specified padding.
plt.plot(x, y)

plt.xlabel('Custom X Label', fontsize=14)
plt.ylabel('Custom Y Label', fontsize=14)
plt.title('My Custom Plot Title', fontsize=16)

# Adjust layout
plt.tight_layout()

plt.show()
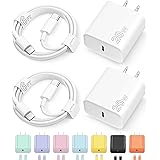
iPhone 17 16 15 Charger Fast Charging Type C Chargers USB C Charger Block iPhone 17 16 15 Air Pro Max Chargers with 6FT Cable for iPhone 17/17 Plus/17 Pro Max/16/16 Plus/16 Pro Max/15 Pro Max/iPad Pro
$9.99 (as of July 17, 2026 15:16 GMT +00:00 - More infoProduct prices and availability are accurate as of the date/time indicated and are subject to change. Any price and availability information displayed on [relevant Amazon Site(s), as applicable] at the time of purchase will apply to the purchase of this product.)Common pitfalls and best practices when customizing axes
Another common issue is forgetting to set the limits of your axes after modifying your data. If you plot new data without adjusting the limits, your plot may not display the full range of values, which can mislead your audience. Always check the limits after making any changes to your dataset.
import numpy as np

# New data
y_new = np.random.randint(1, 20, size=5)

plt.plot(x, y_new)

# Ensure limits are set
plt.xlim(0, 6)
plt.ylim(0, 20)

plt.show()
Additionally, it is essential to consider the context in which your plot will be viewed. If you are sharing your visualizations online or in a presentation, ensure that the font sizes and colors are suitable for various screens. Color choices can also impact readability, so opt for color palettes that are accessible to those with color vision deficiencies.
plt.plot(x, y_new, color='blue', marker='o')

# Customize ticks and labels with accessible colors
plt.xticks(fontsize=12, color='darkblue')
plt.yticks(fontsize=12, color='darkblue')

plt.show()
When working with multiple plots, using subplots can lead to a cluttered appearance if not managed properly. Make sure each subplot has clear labels and titles, and consider using shared axes when appropriate to simplify the layout.
fig, axs = plt.subplots(2)

axs[0].plot(x, y)
axs[0].set_title('First Subplot')
axs[1].plot(x, y_new)
axs[1].set_title('Second Subplot')

plt.tight_layout()
plt.show()
Lastly, be wary of over-customization. While it can be tempting to apply a high number of styles, excessive customization can distract from the data itself. Aim for a clean, professional look that enhances comprehension rather than complicates it.
plt.plot(x, y_new)

# Keep it simple
plt.xlabel('X Axis', fontsize=12)
plt.ylabel('Y Axis', fontsize=12)
plt.title('Simple Plot', fontsize=14)

plt.show()